

Plot incidents and threats
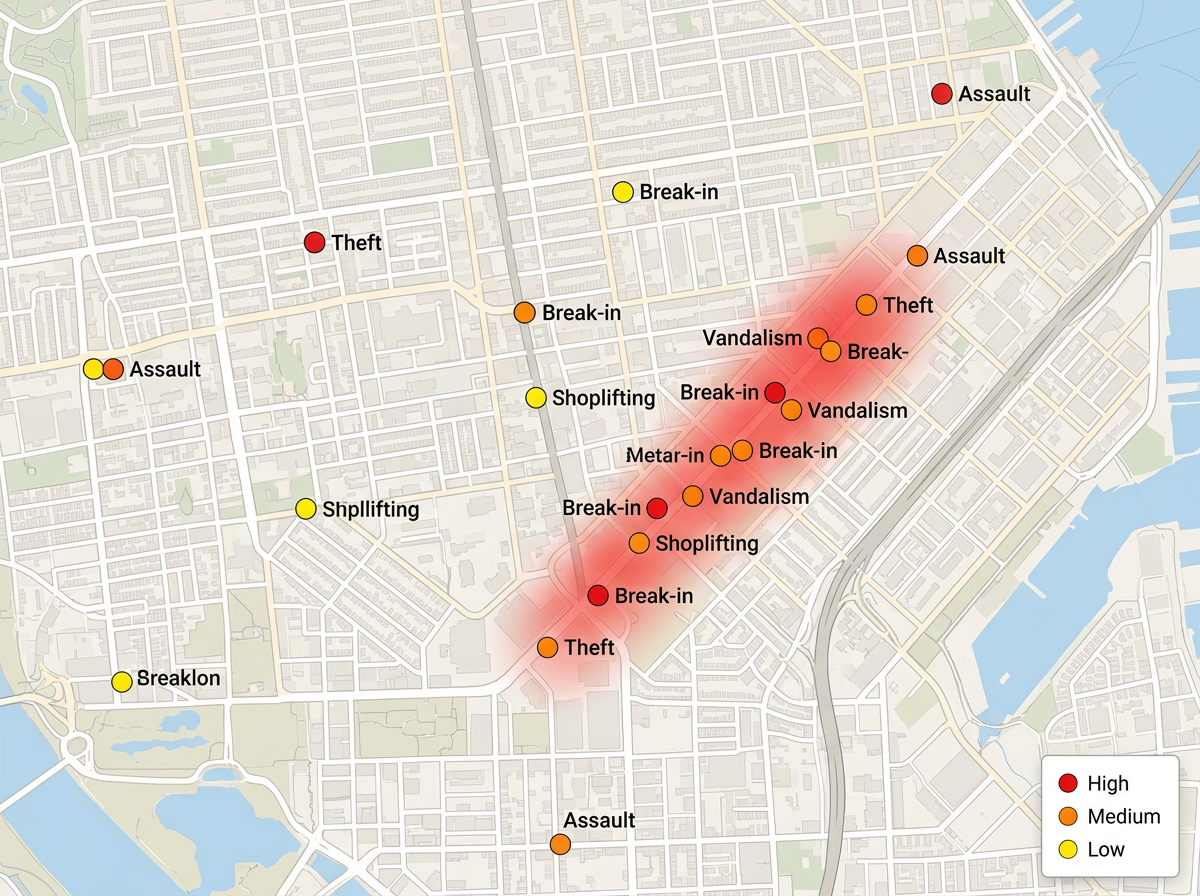
Map crime, security incidents, and threats by location. Color markers by severity and group them by type. Build a clear view of where risk is rising.
Plot incidents, pull in live global event data, and turn it into a clear risk picture. Share the map by link or export it for the board. No GIS training required.
★ ★ ★ ★ ★“Scribble Maps is one of the only software available that lets you make a fully customizable map.”
Drop markers for incidents, threats, and assets. Color them by severity. Import a spreadsheet of events and they land on the map by address or coordinates.
Pull in GDELT global event data to see protests, unrest, and conflict as they are reported. Filter by region and event type so the map shows what matters.
Share the map by link or export to PDF and PNG. Leaders open it on any device and see the same risk picture. No account and no install needed.
Map crime, security incidents, and threats by location. Color markers by severity and group them by type. Build a clear view of where risk is rising.
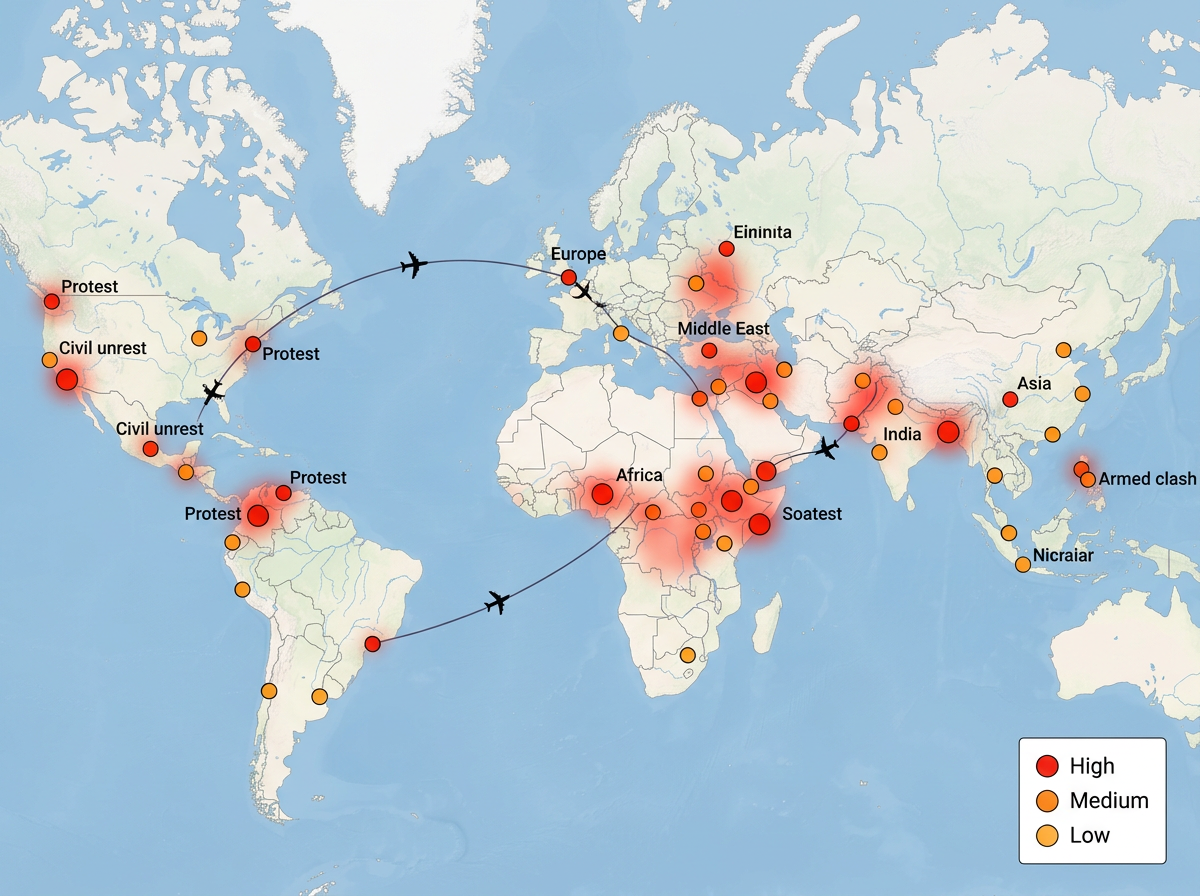
Watch protests, unrest, and conflict worldwide with live GDELT event data. See where staff travel meets rising risk and act early on duty of care.
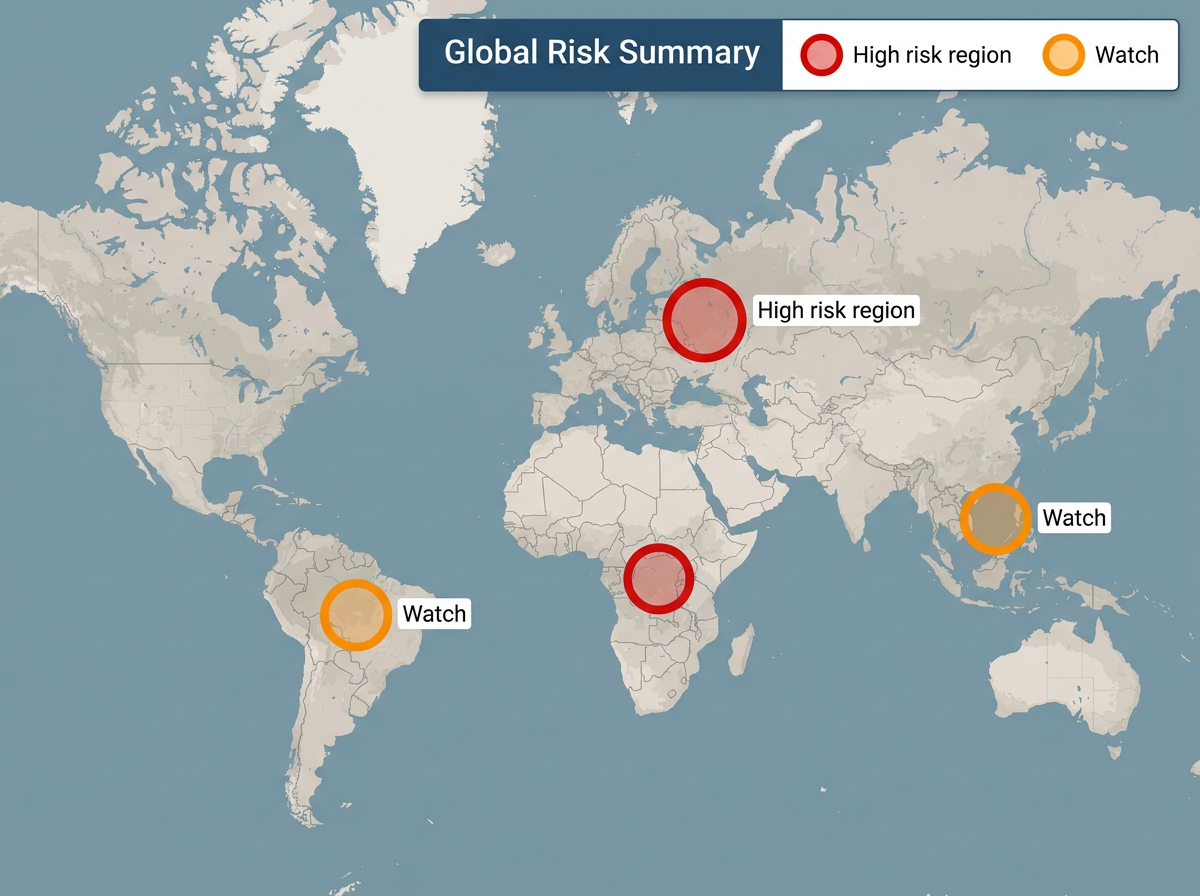
Turn raw events into a clean map leaders understand at a glance. Share by link for live updates or export a snapshot for the briefing deck.
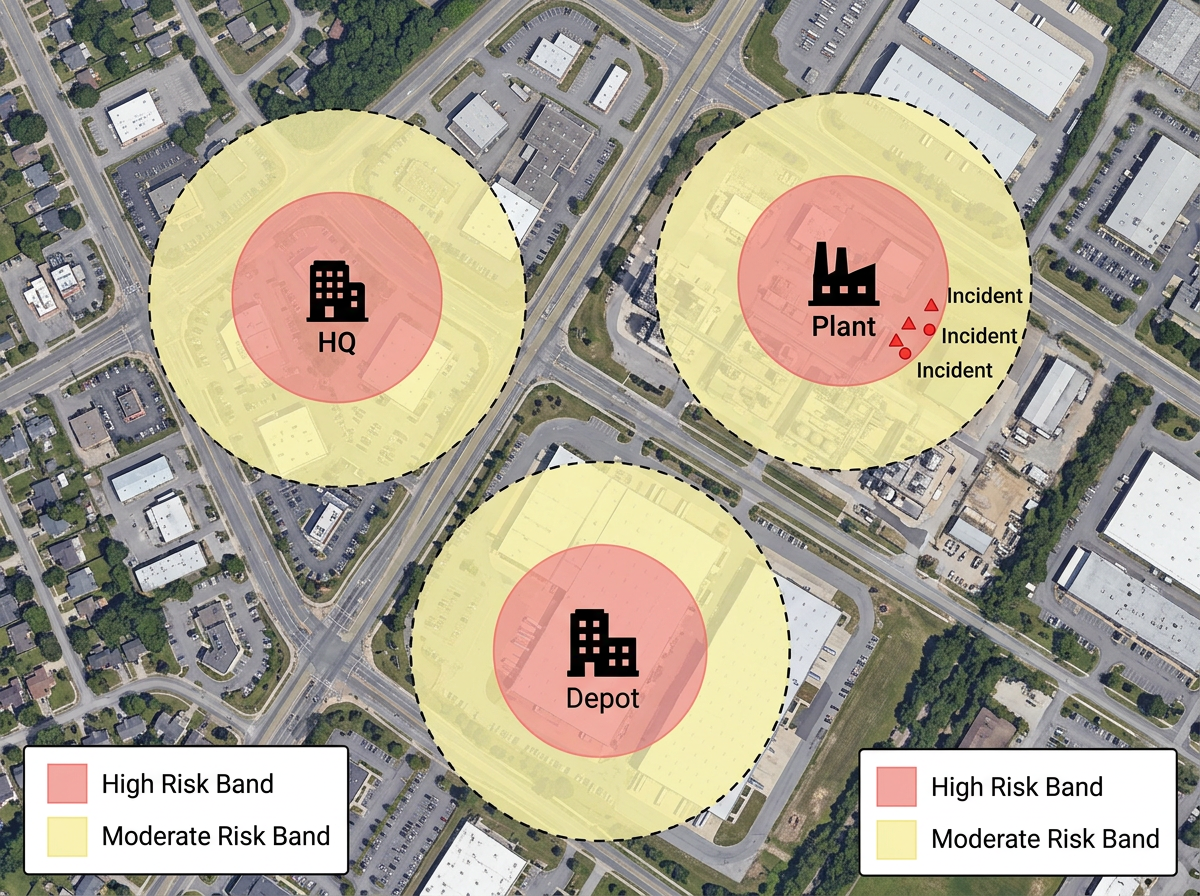
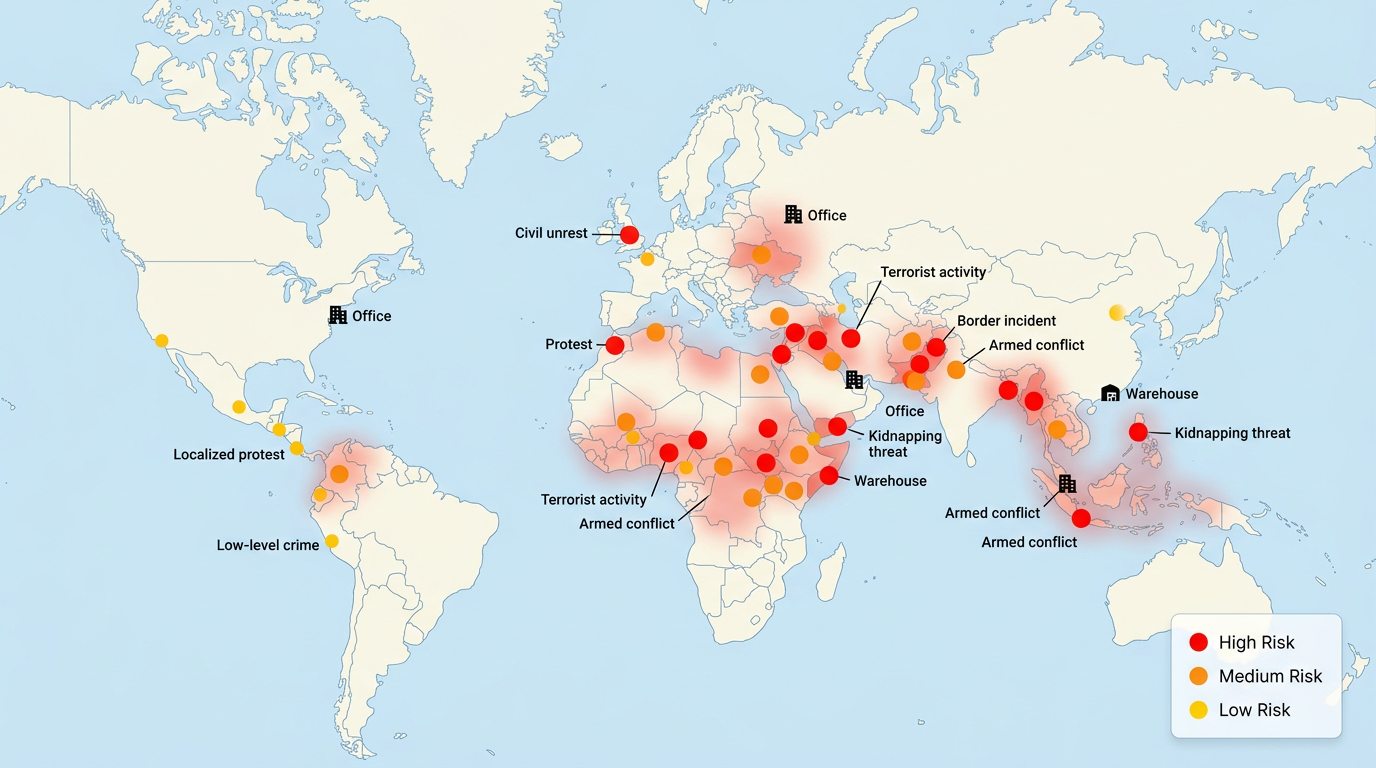
Place your offices, sites, and staff on the map. Overlay nearby risk events and hazard zones to see which assets are most exposed and plan a response.
Scribble AI
Tell Scribble AI what you need. Try “draw a 500m buffer around every site,” “import this CSV and color by status,” or “measure the route from the depot to each stop.” It does it in seconds. No GIS training needed, and your team gets the same map, ready to share.
Try Scribble AI →Security risk mapping is plotting incidents, threats, and events on a map so you can see where risk is concentrated. Scribble Maps lets you build one from your own data and live event feeds, then share it with your team or leaders.
GDELT is the Global Database of Events, Language, and Tone. It tracks events like protests, unrest, and conflict from news worldwide and tags them with a location. Scribble Maps can plot these events so you see global risk as it is reported.
Yes. Import a spreadsheet, CSV, KML, GeoJSON, or Shapefile. Your incidents land on the map by address or coordinates and you can color them by severity.
Yes. Share a link and anyone can open the map in a browser. No account, no install, and no training needed. You can also export a snapshot for a slide deck.
Yes. Maps support AES-256 encryption and private sharing. Keep sensitive risk maps locked to your team and share a link only with the people who need it.
No. Pick a marker, set the location, and choose a color for severity. The map builds as you go, and the AI assistant can plot and style data for you on request.