

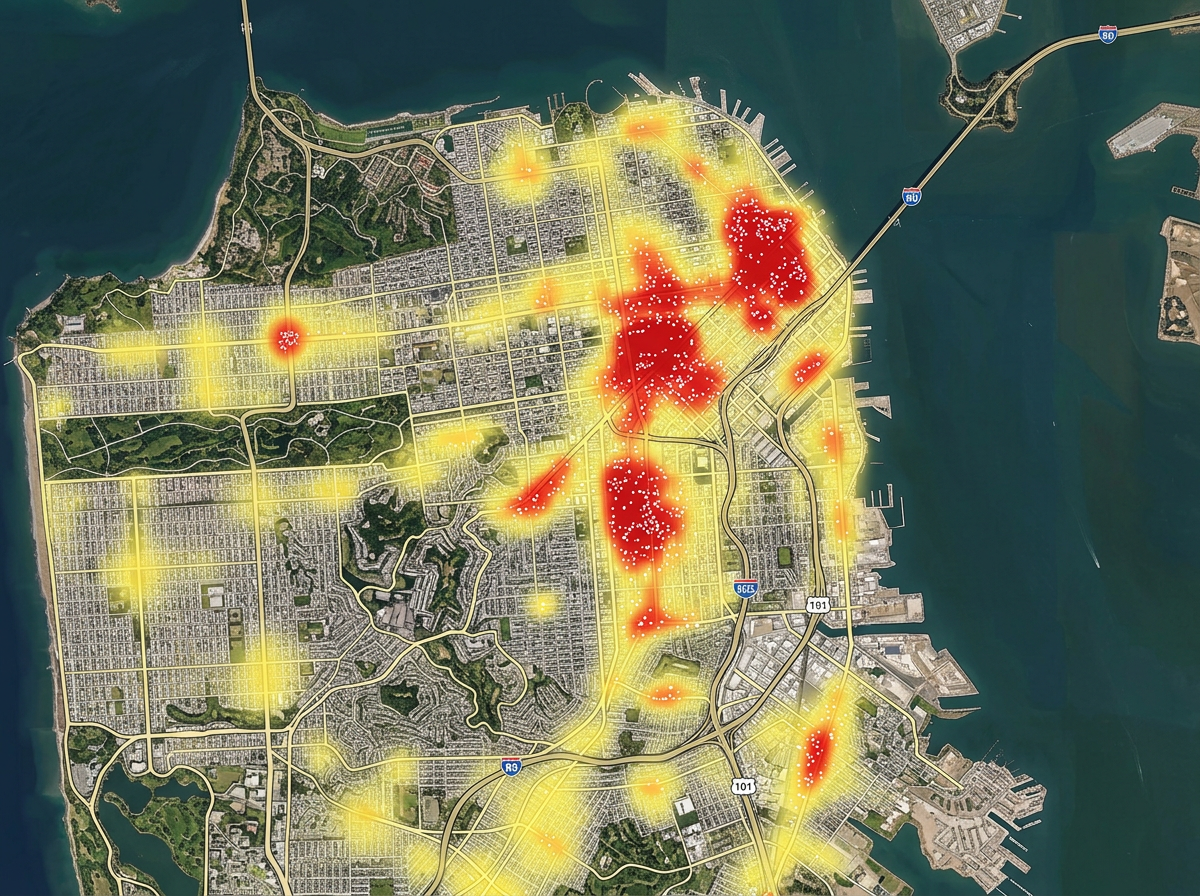
Customer concentration
Plot every customer and overlay a heatmap. See where your base is dense and where it thins out. Plan campaigns and openings around real density.
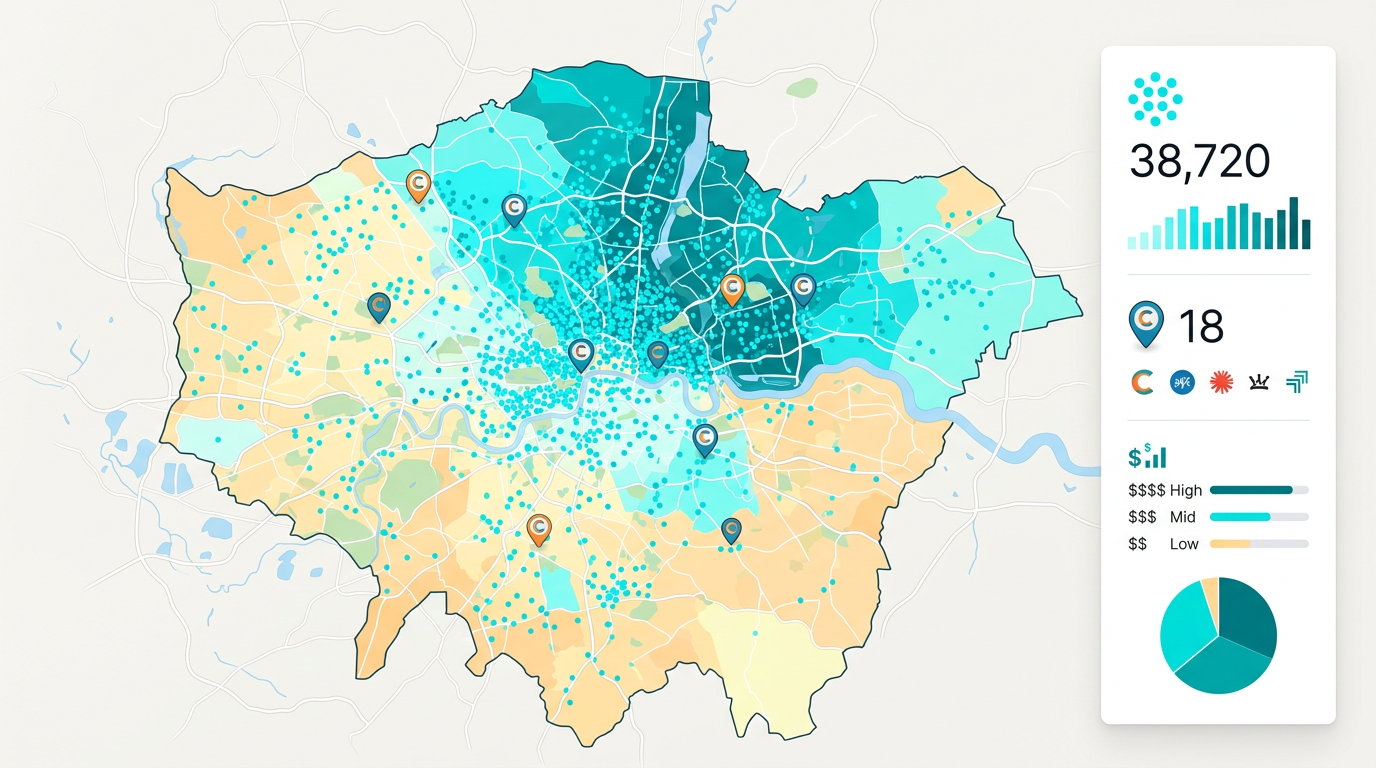
Stack your customers, your competitors, demographics, and any data you have on one map. Find growth pockets, gaps, and the right next move with one clear view.
★ ★ ★ ★ ★“Prospect and constraint analysis for mobility business. Opportunely for the sales staff to utilise.”
Stack your customers, sales, competitors, and demographics on one map. Toggle layers to test ideas. The pattern that matters often only shows up when you stack them.
Import sales, leads, accounts, or any list as a CSV or Excel file. Color zones by value or count and read the map like a chart.
Send a single link to your team, your board, or your investors. Embed the map in a deck. Everyone reads the same picture and the same case for action.
Plot every customer and overlay a heatmap. See where your base is dense and where it thins out. Plan campaigns and openings around real density.
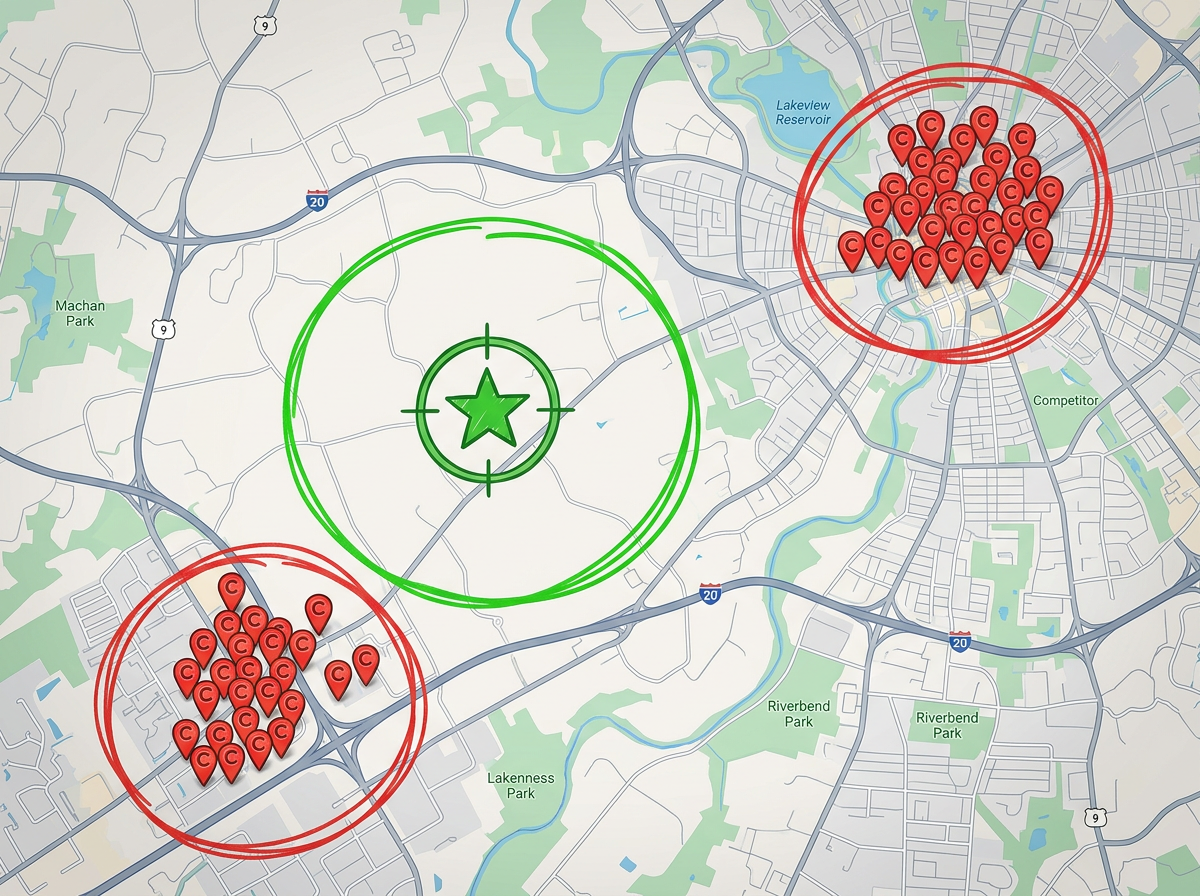
Drop competitor pins or import a list of places. See where competition is heavy, where it is light, and where you can move in fast.
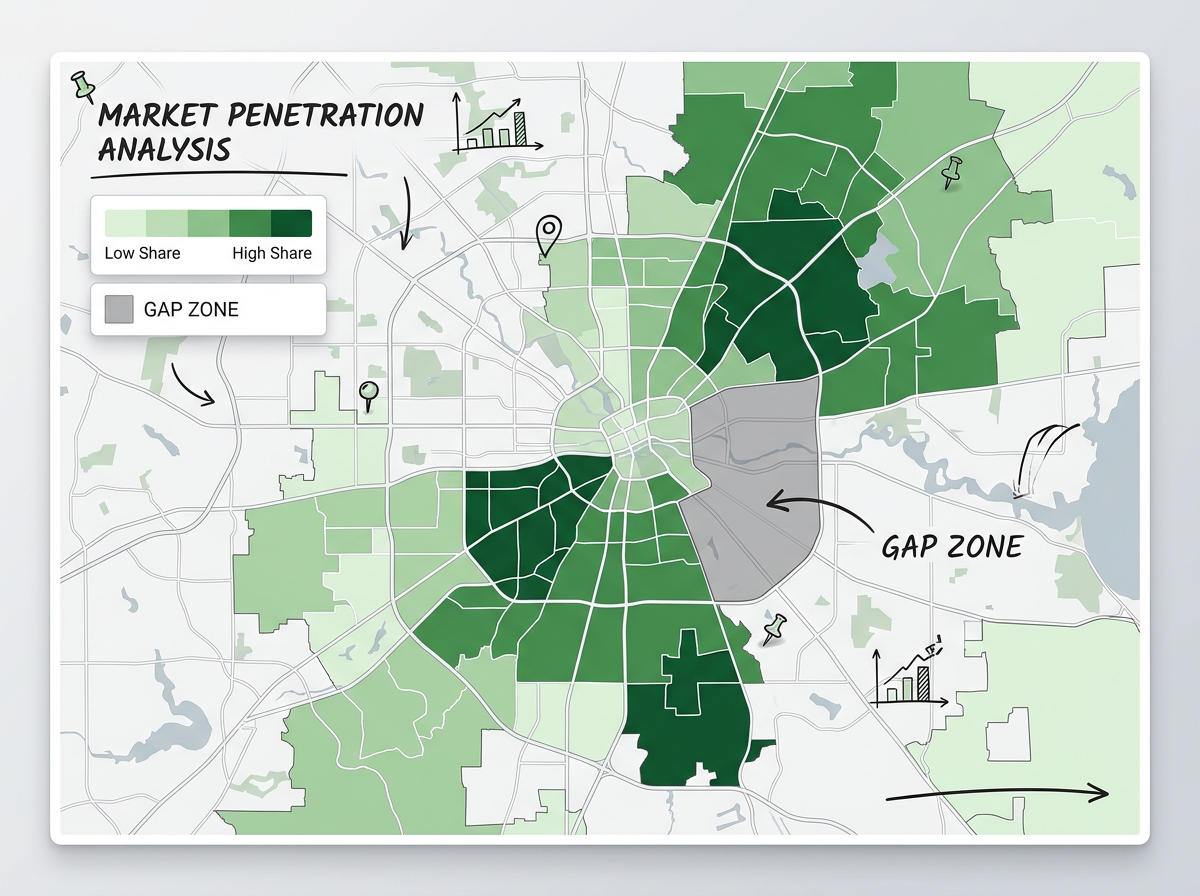
Color zip codes by your market share. Spot gaps where the population is high but your share is low. Build a target list for sales and marketing in minutes.
Scribble AI
Tell Scribble AI what you need. Try “draw a 500m buffer around every site,” “import this CSV and color by status,” or “measure the route from the depot to each stop.” It does it in seconds. No GIS training needed, and your team gets the same map, ready to share.
Try Scribble AI →Market analysis on a map means stacking your customers, competitors, demographics, and other data on one map so geographic patterns become easy to read.
A list of customers or leads is a great start. Add competitor pins or a list of places. Demographics for any zip or polygon are built in, so you do not need to source them yourself.
Yes. Send one link or embed the map in a deck. Viewers pan, zoom, and tap pins. They do not need to know SQL, GIS, or any tool.
Yes. Re-import your file and the map updates. Anyone with the link sees the new picture next time they open it.